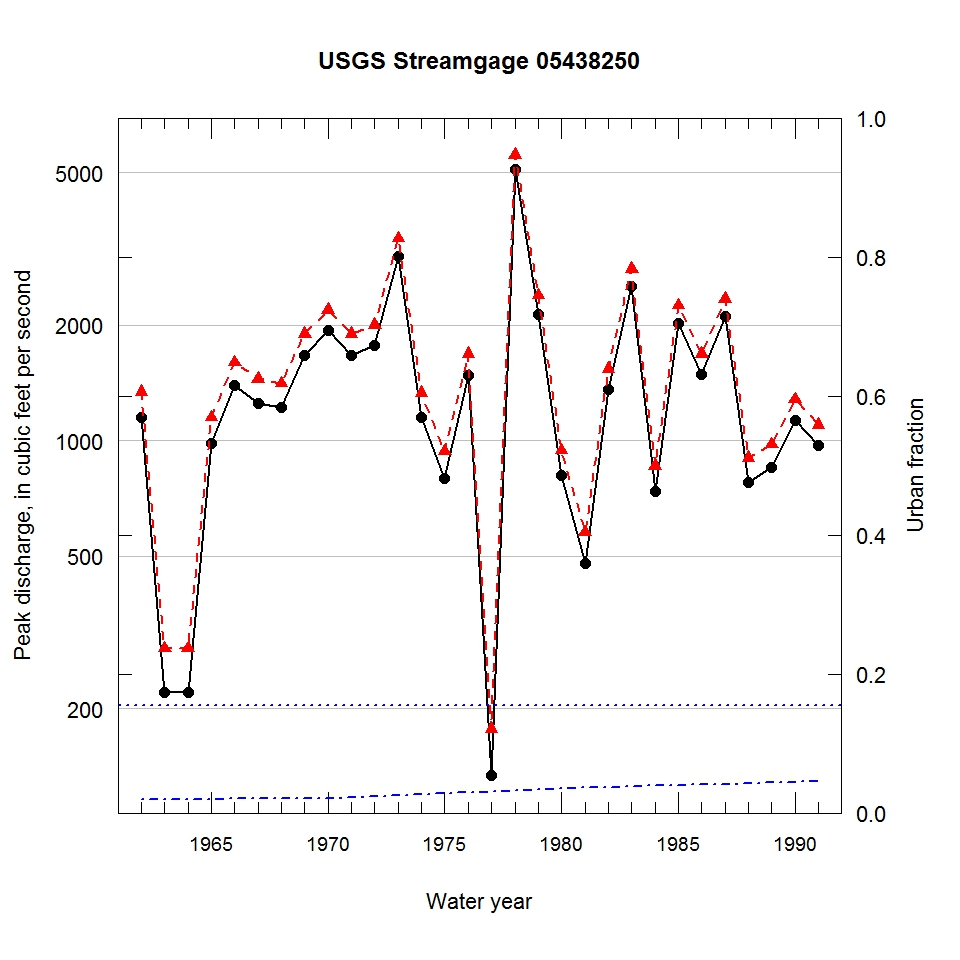
Observed and urbanization-adjusted annual maximum peak discharge and associated urban fraction and precipitation values at USGS streamgage:
05438250 COON CREEK AT RILEY, IL


| Water year | Segment | Discharge code | Cumulative reservoir storage (acre-feet) | Urban fraction | Precipitation (inches) | Observed peak discharge (ft3/s) | Adjusted peak discharge (ft3/s) | Exceedance probability |
| 1962 | 1 | -- | 0 | 0.019 | 0.361 | 1150 | 1340 | 0.499 |
| 1963 | 1 | 2E | 0 | 0.020 | 0.247 | 220 | 287 | 0.975 |
| 1964 | 1 | E | 0 | 0.020 | 0.817 | 220 | 287 | 0.975 |
| 1965 | 1 | -- | 0 | 0.020 | 0.105 | 985 | 1150 | 0.613 |
| 1966 | 1 | -- | 0 | 0.021 | 0.642 | 1390 | 1600 | 0.371 |
| 1967 | 1 | -- | 0 | 0.021 | 1.891 | 1250 | 1450 | 0.441 |
| 1968 | 1 | E | 0 | 0.021 | 1.812 | 1220 | 1410 | 0.459 |
| 1969 | 1 | -- | 0 | 0.021 | 0.127 | 1670 | 1900 | 0.258 |
| 1970 | 1 | -- | 0 | 0.022 | 1.969 | 1940 | 2190 | 0.178 |
| 1971 | 1 | -- | 0 | 0.023 | 0.381 | 1670 | 1900 | 0.259 |
| 1972 | 1 | -- | 0 | 0.024 | 1.053 | 1770 | 2000 | 0.224 |
| 1973 | 1 | -- | 0 | 0.026 | 1.505 | 3020 | 3370 | 0.050 |
| 1974 | 1 | -- | 0 | 0.027 | 0.594 | 1150 | 1330 | 0.506 |
| 1975 | 1 | -- | 0 | 0.029 | 0.794 | 797 | 936 | 0.732 |
| 1976 | 1 | -- | 0 | 0.030 | 1.277 | 1480 | 1680 | 0.338 |
| 1977 | 1 | -- | 0 | 0.031 | 1.255 | 134 | 177 | 1.000 |
| 1978 | 1 | -- | 0 | 0.033 | 2.258 | 5090 | 5560 | 0.012 |
| 1979 | 1 | -- | 0 | 0.034 | 0.289 | 2140 | 2390 | 0.143 |
| 1980 | 1 | -- | 0 | 0.036 | 0.388 | 811 | 943 | 0.728 |
| 1981 | 1 | E | 0 | 0.036 | 1.886 | 479 | 576 | 0.899 |
| 1982 | 1 | -- | 0 | 0.037 | 0.340 | 1360 | 1540 | 0.395 |
| 1983 | 1 | -- | 0 | 0.038 | 1.867 | 2520 | 2800 | 0.086 |
| 1984 | 1 | -- | 0 | 0.039 | 0.766 | 738 | 859 | 0.772 |
| 1985 | 1 | -- | 0 | 0.040 | 0.532 | 2020 | 2250 | 0.168 |
| 1986 | 1 | -- | 0 | 0.041 | 1.088 | 1490 | 1680 | 0.340 |
| 1987 | 1 | -- | 0 | 0.042 | 2.260 | 2110 | 2340 | 0.151 |
| 1988 | 1 | -- | 0 | 0.043 | 1.005 | 779 | 900 | 0.753 |
| 1989 | 1 | -- | 0 | 0.044 | 1.183 | 850 | 976 | 0.709 |
| 1990 | 1 | -- | 0 | 0.045 | 1.591 | 1130 | 1280 | 0.534 |
| 1991 | 1 | -- | 0 | 0.047 | 1.233 | 970 | 1100 | 0.639 |

